Creating an app to enhance public transport… during a pandemic
April 26, 2024
Artificial intelligence and big data at the service of Barcelona residents
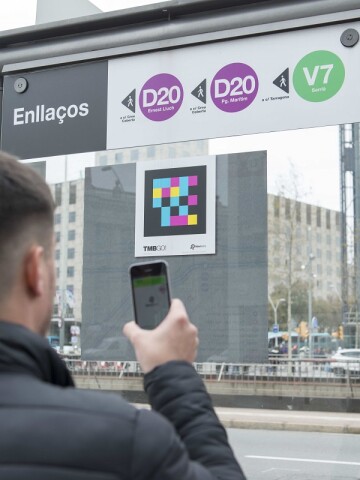
At the beginning of 2020, Barcelona’s metropolitan transport company TMB saw that their user-facing app was great when everything was running smoothly. But, it had no way of sharing alternative routes when events like traffic jams, construction or protests disrupted public transportation routes in the dynamic city.
At the same time, they wanted to learn how to use the Google Cloud Platform.
That’s when SNGULAR came in. Our Data & Artificial Intelligence Team came up with several ideas and solutions to solve their problem using data gathering, processing, storage and visualization technologies.
The challenge
Just as the project was getting started, Covid-19 arrived. The vast majority of the users of the app were staying home, which meant there was hardly any data to collect, measure or anything to predict.
So, TMB and SNGULAR decided to pivot the project. Instead of predicting alternative routes, it started by tracking the number of users who were in metro cars, buses or waiting at stops. As the problem shifted to concerns over social distancing, we were able to respond with agility.
“We found ourselves at the pandemic's onset alongside TMB, rendering the original project obsolete. The pandemic itself guided us towards a new project focus: quantifying the footfall at every metro station or bus stop,”
Sergio Estaban Adán, Cloud Engineer at SNGULAR
The solution
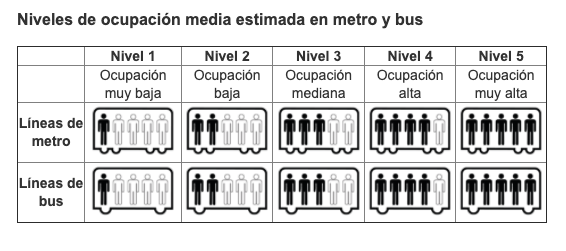
It was increasingly important and urgent to know how many people were in specific places, so we decided to start tracking data related to influxes of people at bus or metro stops throughout the day.
We had to design a data model. It was a conceptual product, born from our accumulated experience in projects that focused on the real-time processing of data. It was set up to maximize the value of the data, for rapid implementation, robustness and scalability. Maintenance costs were also designed to be as low as possible.
Development with the client
The data was compiled from various sources like sensors at stops or in wagons. We had to find a way to make them easy to interpret and provide TMB with a user-friendly dashboard. Since the project was built on the Google cloud, it made the most sense to use Data Studio to interpret the data.
“To work on this data and obtain automatic results may seem abstract, but if you make it so that it can be easily visualized, it helps ensure that the information is relevant and everyone can make the most of it,”
Summary of the solution
The quick reaction and adaptability of both TMB and SNGULAR led to the creation of an app for TMB users that had a new utility — combating the spread of Covid-19.
- Robust and scalable architecture
- Potential to grow vertically and include data from other operators
- Ability to manage information in near real-time
- Considerable data storage for future analyses
- Dashboards with up-to-date information
- Panels that are easy to share with third-parties
- No vendor/provider lock-in
“If anything defines SNGULAR’s DNA, it’s the capacity to adapt to change and come up with innovative solutions in complicated situations. It was a drastic change in the middle of the project, and I believe that it showcases our agility and how we’re able to make the most of our resources to deliver the most possible value to our clients,” added Luis.
This sentiment was reflected by Penélope Los Arcos, the Sales Manager of Media Platforms at Google.
“All the work that SNGULAR did for TMB really demonstrates the company’s mastery of the Google Cloud Platform tools, their advanced knowledge of IA development and how to apply it to practical cases,” she said.
The technicalities
The project's architecture is in Google Cloud Platform.
Most of the architecture was implemented with the Google Kubernetes Engine (GKE).
To synchronize the data, we used Kafka PubSub.
Google Data Studio will use this file to show the occupancy information on a map. It facilitates the visualization of the data in a dashboard for the client.
The infrastructure’s resources, like the GKE cluster, the BigQuery data and the GCS buckets were implemented with Terraform.
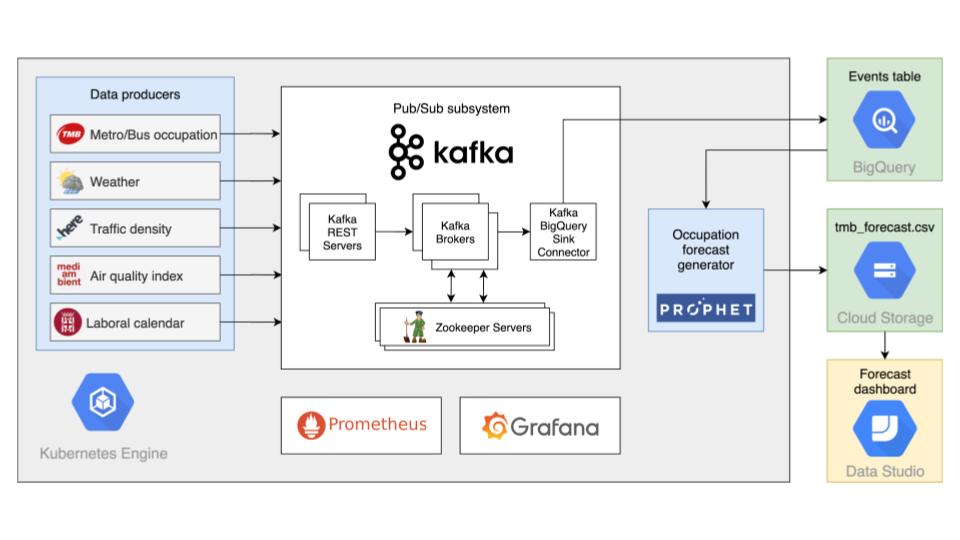 This is the project architecture, placed in Google Cloud Platform.